In Part 1 of “Is It 1957 or 2017?” I pose the following, “How should the mathematical content we teach be different in 2017 compared to 1957? Should we be teaching new things? Should we be teaching old things in new ways?” Let’s explore this a bit. Note that one could write for days in response to these questions…this is just a teaser to start some thinking and maybe some conversations.
What is math?
Conrad Wolfram, in a Ted Talk, poses the question, “What is math?” You might take some time to answer this for yourself before you continue reading.
Wolfram argues that mathematics is
- Posing the right question.
- Converting the real world situation to a mathematical representation or model
- Computation
I would like to add a fourth bullet:
- Posing the right question.
- Converting the real world situation to a mathematical representation or model
- Computation
- Analyze, interpret, connect back to the real world situation.
Typically…traditionally…even still in 2017…students spend a lot of time…most of their time…on one of these four bullets…COMPUTATION! And computation is the one thing that a computer can do better than any human (with apologies to Scott Flansburg…the Human Calculator)! Why not spend more time grappling with interesting situations, posing questions, creating a mathematical model, computing/solving/doing something (even using technology), analyzing/interpreting results?
An Example
Suppose you are teaching a 7th-8th grade math class and want students to experience these four things (posing questions, convert to math, compute, analyze). You can see the classroom resources for this lesson here. Here is a way that it might play out:
- Show students the following video (stopping after just a couple of minutes)
It probably doesn’t take long before a question emerges in viewer’s mind…how long does it take to preheat this oven to 400 degrees so I can cook my frozen pizza?
2. In the classroom resources, students are provided with an increasing amount of data so that models can be created. Is the temperature increasing at a constant rate? If so, we can use a linear model. Given this model, can we predict the time needed to preheat the oven?
3. Once models and assumptions are determined and articulated, computations can be performed to make the prediction.
4. Take the result and clearly describe what it means and also recognize any limitations. Is a linear function, for example, really the best choice? Why or why not? What would that mean? What could we do to determine a more accurate estimate?
What Math Do We Teach?
When we start thinking about mathematics as a tool to model real-world phenomena and to make predictions, new math ideas might become relevant. For example, when modeling real-world data with function models, students might encounter a statistic known as the coefficient of determination. On the TI-84, it looks like this when creating a linear regression model and is designated by “r squared”:

What does this value mean? How is it computed? Why is it computed that way? If mathematical modeling becomes a focus, I will argue that ideas like understanding the coefficient of determination should become a part of a student’s mathematical experience! I you are interested in making sense of the coefficient of determination, consider reading this post.
What other mathematical ideas might become important or necessary in 2017? How about topics in discrete mathematics and statistics? As we have recently (mid-late 2016) been focused on presidential election politics, it could be very useful and important for the general public to have a greater understanding of polling techniques. In fact, right after the election, many news outlets discussed the “failure” in the polling process since most of the polls predicted a win for Hillary Clinton. What is a poll? How are they conducted? Why do they only ask around 1000 people? What is a random sample? What is the margin of error? There are so many good discussions and real-world contexts that could be used to engage students in statistical thinking!
There are many initiatives pushing to include quantitative literacy as a critical component of a student’s educational experience (read Lynn Steen, Deb Hughes-Hallet, AMATYC, MAA).
For a crash course, here is an example of why quantitative literacy is important…consider the following showing Average monthly temperature in New Haven, CT. Image: Yale University:
Global Warming Out of Control

Do you see what is happening here? The data/graph only show temperatures for the first half of the year! Of course temperatures are increasing!
What to Teach or Not to Teach?
There is so much to say…but…just to capture my thinking I will post the following for the purpose of discussion. This is not meant to be an exhaustive list. Rather, the items shown are representative of the idea of what we might think about starting/keeping or stopping.
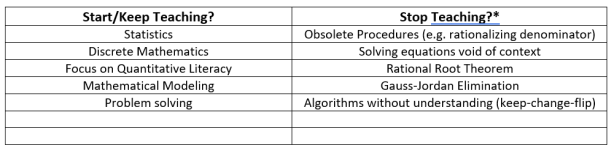 * Obsolete procedures or certain procedures/computations may be studied from a historical perspective

As stated in Part 1, the intent is to have a conversation that I think is worthy of our attention so that the education our children receive isn’t simply what it is because that is the way we have always done it. Rather, it is what it is because what we have thought carefully about what expect students to learn to do and understand.
Scott
