The graphing calculator has changed how mathematics is taught and what mathematics is taught in school mathematics (Burrill, Allison, Breauz, Kastberg, Leatham, Sanchez, 2002). Students can experience mathematics in ways that were inaccessible prior to the introduction of the graphing calculator into mathematics education. With the availability of graphing technology as well as other technology, it is important for students to interpret the meaning of computational outputs provided by this technology. It is our contention that many students are not able to provide meaningful interpretations of the computational outputs provided by technology and feel they are engaged in a game of trivial pursuit – a mindless exercise of seeking facts and trivia. To illustrate my point, consider a situation when a student is asked to create a linear regression model and is asked to interpret the meaning of the coefficient of determination ( r^2 ). A typical response would be: “if the value of r^2 is close to 1 then that is “good” and if the value of r^2 is not close to 1 than that is “bad”.  We suggest that this is evidence that the student is engaged in the pursuit of trivia and may respond with a true statement when asked, but, could not explain the meanings involved in the coefficient of determination. Furthermore, our experience tells us that students are often unable to give the details of how the coefficient of determination is computed and as a consequence cannot articulate what this particular statistic is measuring thereby rendering the whole exercise of determining the value pointless.

We believe that an overarching goal of mathematics education ought to be to engage students in the activity of sense making which can lead to a profound understanding of a particular mathematical idea (Ma, 1999). The National Council of Teachers of Mathematics claim that a “high school mathematics program based on reasoning and sense making will prepare students for citizenship, for the workplace, and for further study.” (NCTM, 2009). Furthermore, “a focus on sense making, when developed in the context of important content, will ensure that students can accurately carry out mathematical procedures, understand why those procedures work, and know how they might be used and their results interpreted.” (NCTM, 2009).

In this article, we specifically focus on making sense of the coefficient of determination and suggest that this be an important endeavor for students studying linear functions in an algebra course and not just for students taking statistics. With the wide spread use of the graphing calculator in the algebra classroom, we believe that teachers should be encouraged to help students make sense of all numerical quantities that they are asked to calculate including the coefficient of determination. The importance of statistical literacy is highlighted in a recent article written by NCTM president J. Michael Shaughnessy who says, “statistical literacy has risen to the top of my advocacy list, right alongside numeracy, and perhaps even ahead of “algebra for all”” (Shaughnessy, 2010).

The goal of this article is to present a way that students can be encouraged to make sense of the coefficient of determination while studying linear function models (linear regression models) in an algebra course. We hope that readers might consider the approach taken here and adapt it for students so that they are afforded the opportunity to make sense, and ultimately demonstrate a profound understanding of the coefficient of determination.\

Why Is It Called Regression?

Why is the process of generating a linear function model for a given data set called “linear regression?” During the 1870‟s, Sir Francis Galton studied the heights (he called it stature) of parents and their offspring. He investigated the relationship between the average height of parents that the height of their offspring. What Galton observed and recorded was that the offspring of particularly tall parents were also tall – but not as tall as their parents. The offspring of particularly short parents were also short – but not as short as their parents. That is, the offspring of these parents tended to be less tall or less short – they regressed toward the mean height of the population.

We see this “regression toward the mean” in many real-life situations. If a basketball player scores an extraordinarily high number of points in one game, he most likely will not score as many points in the next game. The number of points will “regress toward the mean” or be closer to the player‟s average number of points per game. The coefficient of determination is computed, and ultimately understood, as we compare data values to the mean (average) of the values in the data set.

Coefficient of Determination

Graphing calculators can be set to output the coefficient of determination, r^2, when computing a linear regression model.

ti84

The coefficient of determination is a value that describes the strength of the fit of a linear regression model to a set of data. The stronger the fit, the closer this value, r^2, is to 1. However similar claims can be determined by interpreting the correlation coefficient, r , so being able to understand the coefficient of determination can help one distinguish between these two values. This leads us to ask, how is r^2 computed and what does it mean? We explore a contextual situation in answering these questions.

According to a U.S. Internal Revenue Service review of tax returns and a survey conducted by Indiana University, the total amount of private philanthropy funds increased during the 21st century (Source: Statistical Abstract of the United States, 2006; Table 570). Private philanthropy is the act of donating money, by individuals, corporations, or foundations, to support a charitable cause. For example, many colleges and universities accept private philanthropy to fund scholarships for financially needy students. Another example is the George Carver Academy in San Antonio, Texas that is funded by the private David Robinson foundation. We will compute a linear regression model for private philanthropy data then we explore the computation of the coefficient of determination and discuss its meaning.

The table shows the amount of money donated by U.S. residents, corporations and foundations for philanthropic purposes from 2000 to 2003 (Source: Statistical Abstract of the United States, 2006; Table 570). Algebra teachers often ask students to generate a linear regression model for the data, to interpret the parameters of this model (the vertical intercept and the constant rate of change) in the context of the situation, and to use the model to make a prediction (extrapolate or interpolate).

table-1

We use a graphing calculator to compute the linear regression model.

regression-model

We write this linear regression model F(t) = 4.41t + 226.26 . The model suggests that in 2000 ( t = 0 ), $226.26 billion in private philanthropy funds was given and the amount increases each year at a constant rate of $4.41 billion per year. We can use this model to predict the amount of private philanthropy funds that will be given in 2010. Since 2010 is ten years after 2000, we substitute into this regression model.

F(t) = 4.41t + 226.26
F(10) = 4.41(10) + 226.26 = 270.36

Using the regression model, we predict that $270.36billion in private philanthropy funds will be given. Furthermore, we can see that the coefficient of determination is approximately 0.93. But how is the coefficient of determination value computed and what does it represent? The coefficient of determination is computed by determining the percentage of “error” that is explained by the linear regression model. In this context, error does not mean mistake. Rather, error is a vertical measurement on the graph of the scatterplot with the regression model. More specifically, there are three types of error – explained error, unexplained error, and total error. These error measurements involve the arithmetic mean (average) and are computed by finding the difference between this mean and the actual data values or the values predicted by the linear model. It is important to recognize that the difference between a data value and the mean of the data values may be a positive or negative number. The absolute value of this number
represents the vertical distance (either above or below) between the data value and the mean of the data values. An alternative way to make negative differences into positive values is to square each difference. This is the approach used in calculating the total error. The total error is the sum of the squares of the differences between the actual data value and the mean of the data values.

To visualize the total error, we compute the arithmetic mean and place it on the scatter plot of the data (see the horizontal line below at 232.875).
mean-computation

graph-1To compute the total error, we find the difference between mean and the data point value, as shown in the graph, by subtracting the data value from the mean. We square this difference so that we do not have to consider whether the value is positive or negative. However, we will recognize that differences (prior to squaring) that are negative indicate data values that are below the mean and differences that are positive indicate data values that are above the mean. The total of the squares of these differences is known as the total error.
table-2This total error can be split into two pieces – the explained error and the unexplained error. The explained error is the sum of the squares of the differences between the regression model output values and the mean.

graph-2The sum of the squares of the differences between the actual data values and the regression line output values is known as unexplained error. This is the rest of the total error that is not taken up by, or explained by the model.

graph-3As we examine these graphs, we see that the explained error (total sum of the squares of the differences between the regression line and the mean) seems to be greater than the unexplained error (total sum of the squares of the differences between data values and the regression line). The coefficient of determination is a computation showing the percent of the total error that is explained or “taken up by” the regression line. Recall that the total error is 104.5275. What percentage of this total error is explained? What percentage is unexplained?

table-3table-4The total error is 104.5275. Of this, 97.2405 is explained and 7.287 is unexplained. As a percentage we find that 93.03% of the error is explained. This value is known as the coefficient of determination. This computation confirms the calculator output for r^2.
compute-percentageregression-model

Making Sense of the Coefficient of Determination

We can go beyond just computing the coefficient of determination to see if it matches with the value that the calculator gives. By examining the computation process, we can see that this value provides useful information about the strength of fit of the regression model to the data set and helps one to further differentiate between r and r^2. We look at two extreme hypothetical situations to make sense of this value. Consider the following hypothetical situation of a perfectly linear data set.

table-5The mean of the y values of the data set is 12.5.

mean-computation-2We see, by looking at a scatter plot of the data, that these data are perfectly linear. Since each data point lies on the regression line, we see that the total error differences (difference between the data value and the mean) and the explained error differences (difference between the regression line and the mean) are the same.

graph-4Since the total error differences (difference between the data point and the mean) and the explained error differences (difference between the regression line and the mean) are the same, the ratio of explained error to total error is 1.
equals-1Also, the unexplained error differences (difference between data point and regression line) total 0. That is, all of the total error is taken up by or explained by regression model. We now consider a situation where two quantities have very little or no relationship.
table-6
The mean of the y values of the data set is 2.

mean-is-2In this special situation, the regression model is y = 2; the same as the mean.

ti84-2The total error (differences between the actual data value and the mean) is a relatively large value, as seen in the graph.

graph-5However, the total explained error (difference between the linear regression model and the mean) will be 0 since these two lines coincide.

equals-0By examining these distances, we can estimate the value of r^2 , the coefficient of determination, and do not need to rely solely on the calculator to output the number. Remember, the coefficient of determination measures the strength of fit of the linear regression model to the actual data. The stronger the fit, the closer r^2 will be to 1.

Estimating the Coefficient of Determination

The data in the graph show the number of registered vehicles in the United States for selected years after 1980 (Statistical Abstract of the United States, 2006; Table 1078). The horizontal line in the graph is the mean of the data set. We can estimate whether the coefficient of determination is closer to 0, closer to 0.5, or closer to 1 and explain how we know.

graph-6It appears as though the coefficient of determination would have a value that is close to 1. We see that the total error (difference between the actual data points and the mean) and the explained error (differences between the regression line and the mean) are very similar. The coefficient of determination value, r^2 , is the ratio ratioThis ratio is close to 1 since the values of the numerator and denominator are nearly equal.

The data in the graph show the average winter temperature in New York City for years after 1900 (www.ncdc.noaa.gov). The horizontal line in the graph is the mean of the data set. We can estimate whether the coefficient of determination is closer to 0, closer to 0.5, or closer to 1 and explain how we know.

graph-7

It appears as though the coefficient of determination would have a value that is close to 0. We see that the total error (differences between the actual data points and the mean) will be relatively large due to the fact that the data are so spread out around the mean of 23.38o. However, the explained error (differences between the regression line and the mean) is relatively small. The coefficient of determination value, r^2 , is the ratio ratioThis ratio is close to 0 since the numerator is relatively small and denominator is relatively large.

Summary

This article raises several issues. One issue is related to the role that learning about the coefficient of determination ought to play in the algebra classroom. We support the notion that the coefficient of determination ought to be explored fully while students are studying linear function models developed from real-world data. With the widespread use of graphing calculators, this statistic is available to students and therefore should be investigated in terms of its method of computation which should then lead to its interpretation. A second issue is related to the notion that students should be afforded many opportunities to make sense of the mathematics they study. That is, students ought to learn that mathematics is something to be made sense of rather than a litany of trivia that is to be memorized. Students can learn to make sense of mathematical ideas only if they are given many opportunities to practice the mental exercise of doing so. The process of making sense leads to understanding of foundational mathematical ideas. It is our belief that students who strive to understand mathematics will be more successful and progress further in studying mathematics. Hiebert, et al. claim that “understanding breeds confidence and engagement; not understanding leads to disillusionment and disengagement (1999).” We have found that Algebra students will work to make sense of the coefficient of determination in the context of a linear function modeling situation and can demonstrate their understanding of the this statistic by estimating the value of the coefficient of determination given the opportunity and a supporting educational environment and curriculum.

References

Burrill, G., Allison, J., Breauz,G., Kastberg, S., Leatham, K., Sanchez, W. (2002). Handheld graphing technology in secondary mathematics: Research findings and implications for classroom practice. Texas Instruments

Hiebert, J., Carpenter, T., Fennema, E., Fuson, K., Wearne, D., Murray, H., et al. (1997). Making sense: Teaching and learning mathematics with understanding. Portsmouth, NH: Heinemann

Ma, L. (1999). Knowing and teaching elementary mathematics: Teachers’ understanding of fundamental mathematics in China and the United States. Hillsdale, NJ: Lawrence Erlbaum Associates, Inc.

National Council of Teachers of Mathematics (2009). Focus in high school mathematics: Reasoning and sense making. Reston, VA: NCTM

Shaughnessy, J.M. (2010). Statistics for all—The flip side of quantitative reasoning. NCTM Summing Up August 2010 Message from the President. Retrieved August 2, 2010 from http://www.nctm.org/abou /content.aspx?id=26327

Is It 1957 or 2017? (Part 2)

Posted: January 21, 2017 in Uncategorized

In Part 1 of “Is It 1957 or 2017?” I pose the following, “How should the mathematical content we teach be different in 2017 compared to 1957? Should we be teaching new things? Should we be teaching old things in new ways?” Let’s explore this a bit. Note that one could write for days in response to these questions…this is just a teaser to start some thinking and maybe some conversations.

What is math?

Conrad Wolfram, in a Ted Talk, poses the question, “What is math?” You might take some time to answer this for yourself before you continue reading.

Wolfram argues that mathematics is

  • Posing the right question.
  • Converting the real world situation to a mathematical representation or model
  • Computation

I would like to add a fourth bullet:

  • Posing the right question.
  • Converting the real world situation to a mathematical representation or model
  • Computation
  • Analyze, interpret, connect back to the real world situation.

Typically…traditionally…even still in 2017…students spend a lot of time…most of their time…on one of these four bullets…COMPUTATION! And computation is the one thing that a computer can do better than any human (with apologies to Scott Flansburg…the Human Calculator)! Why not spend more time grappling with interesting situations, posing questions, creating a mathematical model, computing/solving/doing something (even using technology), analyzing/interpreting results?

An Example

Suppose you are teaching a 7th-8th grade math class and want students to experience these four things (posing questions, convert to math, compute, analyze). You can see the classroom resources for this lesson here. Here is a way that it might play out:

  1. Show students the following video (stopping after just a couple of minutes)

It probably doesn’t take long before a question emerges in viewer’s mind…how long does it take to preheat this oven to 400 degrees so I can cook my frozen pizza?

2. In the classroom resources, students are provided with an increasing amount of data so that models can be created. Is the temperature increasing at a constant rate? If so, we can use a linear model. Given this model, can we predict the time needed to preheat the oven?

3. Once models and assumptions are determined and articulated, computations can be performed to make the prediction.

4. Take the result and clearly describe what it means and also recognize any limitations. Is a linear function, for example, really the best choice? Why or why not? What would that mean? What could we do to determine a more accurate estimate?

What Math Do We Teach?

When we start thinking about mathematics as a tool to model real-world phenomena and to make predictions, new math ideas might become relevant. For example, when modeling real-world data with function models, students might encounter a statistic known as the coefficient of determination. On the TI-84, it looks like this when creating a linear regression model and is designated by “r squared”:

correlation-coefficient-ti84

What does this value mean? How is it computed? Why is it computed that way? If mathematical modeling becomes a focus, I will argue that ideas like understanding the coefficient of determination should become a part of a student’s mathematical experience!  I you are interested in making sense of the coefficient of determination, consider reading this post.

What other mathematical ideas might become important or necessary in 2017? How about topics in discrete mathematics and statistics? As we have recently (mid-late 2016) been focused on presidential election politics, it could be very useful and important for the general public to have a greater understanding of polling techniques. In fact, right after the election, many news outlets discussed the “failure” in the polling process since most of the polls predicted a win for Hillary Clinton. What is a poll? How are they conducted? Why do they only ask around 1000 people? What is a random sample? What is the margin of error? There are so many good discussions and real-world contexts that could be used to engage students in statistical thinking!

There are many initiatives pushing to include quantitative literacy as a critical component of a student’s educational experience  (read Lynn Steen, Deb Hughes-Hallet, AMATYC, MAA).

For a crash course, here is an example of why quantitative literacy is important…consider the following showing Average monthly temperature in New Haven, CT. Image: Yale University:

Global Warming Out of Control

new-haven-ct

Do you see what is happening here? The data/graph only show temperatures for the first half of the year! Of course temperatures are increasing!

What to Teach or Not to Teach?

There is so much to say…but…just to capture my thinking I will post the following for the purpose of discussion. This is not meant to be an exhaustive list. Rather, the items shown are representative of the idea of what we might think about starting/keeping or stopping.

start-stop* Obsolete procedures or certain procedures/computations may be studied from a historical perspective

As stated in Part 1, the intent is to have a conversation that I think is worthy of our attention so that the education our children receive isn’t simply what it is because that is the way we have always done it. Rather, it is what it is because what we have thought carefully about what expect students to learn to do and understand.

Scott


by Scott Adamson – January 4, 2017

Think about the teaching and learning of K-12 mathematics in a classroom. What images come to your mind? What are students doing? What is the teacher doing? What does the classroom look like? To what extent are the images in your mind dependent on the date? That is, would your images be different in terms of what students or teachers are doing if it was 1957 instead of 2017? Should your images be different?

These questions are of great interest to me right now and I don’t know if I have answers, but I have thoughts. Let me begin by explaining the origin of the question “is it 1957 or 2017?”

Allow me to describe, from a big picture viewpoint, an amalgamation of a mathematics classroom that could be at a school near you. Students are sitting in desks arranged in rows. The class period begins with a set of warm-up exercises that students are to complete in their notebooks. The teacher takes care of administrative details (attendance, paperwork). After a brief amount of time, the answers are displayed and students have the opportunity to have any issues clarified. Next, the class “goes over” last night’s homework. If a student has a question, they can ask and the teacher will show a solution. After several questions are answered, the students pass their homework papers to the teacher. A new topic is introduced and developed and students “take notes”. This means that they watch and copy what the teacher shows them to do. The new homework assignment is given and, with 4 minutes remaining in the period, students pack up their notebooks and prepare for the bell to ring announcing their transition to the next class.

So, what year is it? 1957 or 2017? Everything that happened in this class could have happened in 1957 nearly identically. Are the needs of learners of mathematics the same in 2017 as they were in 1957?

Let’s take a closer look at what happened in this classroom beginning with the content students were expected to learn.

Generally, students are expected to learn to do something. For example, students factor trinomials, solve equations, simplify expressions, compute derivatives and integrals, identify characteristics of a graph of a function, plot the graph of a function by hand, or memorize mathematical facts. Perhaps this was important in 1957 but given the technological advancements in recent years, every student in the classroom has access to a small device that will do, quickly and accurately, most of the things that they are learning to do with paper and pencil. Most students own (or have acccess to) a smartphone or tablet that, when connected to Wi-Fi, can access free and powerful tools such as the Desmos calculator (www.desmos.com), Geogebra (www.geogebra.org), or WolframAlpha (www.wolframalpha.com). Sometimes when I visit classrooms, I challenge myself to see if it is possible to complete any tasks asked of students during that lesson using my cell phone and an appropriate tool like Desmos or WolfrAmalpha. Most of the time I can complete the given tasks and more! For example, in one case students were asked to find the equation of a line that is tangent to an implicitly defined curve. Using Desmos, not only could I get the equation of the line as requested, I could additionally create a graph of both the linear function and the implicitly defined equation! This provided a wonderful, visual confirmation that my thinking was correct.

I am fully aware of the tension between only pushing buttons on a device to make it do something and having a deep, well-connected understanding of the mathematical ideas. Am I able to get my cell phone apps to do the work needed because I learned the mathematics without these tools and understand it well?  How does the teaching and learning of mathematics change if we try to accomplish both the development of the conceptual understanding of the mathematical ideas and the effective and efficient use of technology to solve problem?

Part of my answer to these questions involves considering what mathematics we should teach. In 1957, the technological tools did not exist so it was more important for people to become effective and efficient at computations – perhaps appropriately using a slide rule when necessary. To be effective and useful in 1957 culture, certain skills and knowledge were needed to be mastered by students. Have the skills and knowledge needed changed to prepare students for 2017 culture? If part of the school’s responsibility is to prepare students for careers, have we kept up the pace to do so in 2017 by teaching students to be masterful at antiquated techniques like using synthetic division to divide polynomials?

I want to be a part of the discussion in the mathematics education community related to what mathematics we teach and then how we teach it given the tools we have access to and the cultural needs in the year 2017. Then, I want to see appropriate changes implemented.

How we use current pedagogical tools and the purpose they serve in teaching and learning needs to be addressed as well. I have two examples.

In many classrooms, document cameras, connected to a projector, are used to project images for all in the room to see. We can place anything under the document camera and its image is projected on the screen. This can be a very useful tool allowing students or the instructor to share ideas, methods, strategies, solutions, and procedures. In 1957, this same thing was accomplished (although less efficiently and with less potential in my opinion) using the overhead projector. Is that the difference between 1957 and 2017? We now have expensive* document cameras and projectors rather than overhead projectors but we use them in the same way? That’s it? Rather than writing the solutions to the homework exercises or warm-up assignment on an overhead transparency (which needs to be cleaned at the end of the day), teachers can now write the same thing in a notebook and project the image on the screen. Using a white piece of paper, teachers can cover up anything they don’t want the students to see yet and uncover solutions a little bit at a time – just like 1957 with an overhead projector!

The Smartboard is another example. Many classrooms have been equipped with Smartboards that look like a traditional whiteboard but are connected to a computer and projector. They can be used like a tablet device in that the board can be touched, written on (electronically), images moved, notes recorded, and more. However, in many cases, I observe teachers using the Smartboard in just the same ways they would have used a whiteboard – or a chalkboard in 1957! The Smartboard simply becomes a very expensive (but much smaller) chalkboard and its full potential is not realized.

Is it 1957 or 2017 in terms of the teaching and learning of mathematics? In many respects, it is 1957 when we think about the focus on the teaching of procedures, algorithms, and computations that are more efficiently and effectively completed by technology. It is 2017 when we think about some of the powerful tools that today’s classrooms have access to such as Smartboards and many internet resources. But it is 1957 when we think about how these tools are being used!

My goal for this series of posts is to help us to think about how the teaching and learning of mathematics might be and should be different in 2017 and beyond. Specifically, I hope to share thought provoking comments about these questions:

  • How should the mathematical content we teach be different in 2017 compared to 1957? Should we be teaching new things? Should we be teaching old things in new ways?
  • How can we best use 2017 pedagogical tools such as Smartboards, document cameras, handheld technology, or internet resources to mathematically prepare students for the world?
  • Is there a place for “old school” mathematical ideas in today’s mathematics classroom? For example, should students learn to perform computational skills like factoring, rationalizing denominators, or even computing a square or cube root by hand? If so, for what purpose?
  • How do we assess student learning? Suppose a decision is made to move toward teaching students to solve realistic problems using technological tools appropriately. It has been the practice to show students how to do something (e.g. divide fractions using the “keep-change-flip” algorithm), have them practice doing this skill so that they can get right answers frequently, then assess their ability by asking them to do a routine computation. If they do it – successful teaching and learning! If not, re-teaching and additional practice is needed. How will assessment look in 2017 and beyond?
  • What are the common objections to changing mathematics education and how are these objections refuted? For example, we have all heard teachers say, “what are you going to do if your calculator (now, cell phone, tablet) loses battery power? Then what will you do?” Or, “what will you do if you are stranded on a deserted island?”
  • How do we prepare our teaching force to make any proposed changes?
  • How do we prepare parents to support their children if any changes are made?


* I found a 3M 9100 Overhead Projector (the last I remember using) for $170 on Amazon and the Aver 5MP Document Camera (that I currently use) for $630.

I stumbled across another misinformed, incorrect video purporting to show how “frightening” the common core standards are.

The mathematical issues brought up in this video are the same as the issues I address in many of the other posts about Misunderstanding the Common Core. Please read those. But, here are some new thoughts that this video created in me.

Thought #1 – The anti-common core movement really likes to pick on the idea of subtraction! I wonder why? There must be hundreds of other standards and yet, apparently, only subtraction brings up these emotionally charged challenges to the common core standards. Are we to think that if subtraction is “frightening” then all other standards are “frightening as well?” Is that good thinking?

However, as I have tried to explain in the other posts, the method of subtraction shown in this video is not bad! The lady in the video shows how 43 – 13 is computed. First, 3 – 3 is zero…write a zero below the 3’s. Then, 4 – 1 is 3…write a 3 below the 4 and 1. The answer is 30. Done.

The so-called common core method to subtract is a method related to counting back change. It is a method where one counts back, starting at 13, to 43.  Thirteen plus 2 is fifteen. Fifteen plus 5 is 20. Twenty plus 10 is 30. Thirty plus 10 is 40. Forty plus 3 is 43. Note, we counted back 30 units. Therefore, 43 – 13 = 30. No big deal.

Thought #2 – Even though I have no problem with the “counting back change” method as ONE POSSIBLE method to subtract 43 -13 = 30, this is not the “common core way” as reported in this video. I challenge any reader to show where, in the actual common core standards document, it says that subtraction must be done in this way or any particular way! In fact, I find the following standard:

4nbt 1

To say that the common core standards require one method of subtraction over another is just not true.

Thought #3 – Just because a person doesn’t understand something does not mean this is a bad thing! I think that the lack of mathematical content knowledge of the general population in the US is a big reason for the so called “frightening” aspects of the standards. As I have tried to explain in all of these posts, there is nothing frightening about the standards! Rather than to react to something that one doesn’t know much about, I challenge everyone to become more aware of the standards. Read them. Ask questions. Study. Then if you have a legitimate, well-reasoned concern, then certainly engage in a respectful discussion about the issue!

This sounds like something we could all learn to do in other areas of our lives as well…

Scott


Here we go again! I just saw the following on Facebook:

CC X

What was wrong with the old way? Before I answer…IT”S NOT THE OLD WAY! It’s just A WAY! If you want to read much about misunderstanding the common core, consider the other posts with a title “Misunderstanding the Common Core Parts I-IX”. I will reiterate, recap, and re-explain for anyone new to this blog.

When we subtract as shown at the bottom of the image, 568 – 293 = 275, there is a lot going on in terms of understanding the algorithm. Understanding the algorithm is what allows us to be efficient and accurate in computing by hand. Which brings us to an interesting issue: most people would use a calculator to do this!

Suppose you were going to attempt to compute 568 – 293 in your head. Or, suppose you were estimating. You might start with 568 – 200 = 368 just to get the thinking started. You might estimate/round 293 and say it is nearly 300 so 568 – 300 is about 268. Here’s my point…the most important digits are the digits in the 100’s place not the 1’s place! It is much more natural to start with the 100’s place than with the 1’s place as is traditionally done.

Let’s get back to it…once we think 568 – 200 = 368, the next thing to think about is the 10’s place. Let’s subtract 90 more. 368 – 90….hmmmmm…well…368 – 60 would be 308….hmmm…10 more…308 – 10 = 298….hmmm…20 more…298 – 20 = 278. It’s hard to do in writing but what I am trying to convey is that when people think about computations mentally, they might first focus on easier computations…subtracting 60, then 10, then 20 is much easier to do in my head that subtraction all 90 all at once.

So, we have subtracted 568 – 290 so far and have arrived at 278. Now subtract 3 more…278 – 3 = 275. There  you go! 568 – 293 = 275!

It would happen much faster in my head in reality than it seems when you read through everything that is happening in my head. Here it is in one, smaller space:

568 – 293….well, 568-200 = 368….now 368 – 90 is 368 – 60 = 308 and 308 – 10 = 298 and 298-20 = 278. Finally, 278 – 3 = 275…done…and fast!

What’s wrong with the old way? Nothing! What’s wrong with thinking, focusing on place value, mental math, understanding algorithms, and number sense? Nothing!

Here is the bottom line to me when it comes to this particular image. When we try to explain our thinking and show all the details of doing a simple subtraction problem, it might look convoluted and confusing. When we really think about how things work and try to understand the structure of the algorithm, it can make perfect sense!

One more thought…at the bottom of the image, we see this…

common core x part 2

People look and say…wow, look how easy that was compared to that new, crazy math that my kids are coming home with! Yea, right! There is so much missing that many 3rd graders would not understand!

Likely, people would start on the right and find that 8 – 3 = 5. Fine.

Next, people would look at the 10’s place…6 – 9…hmmm…you can’t take 9 from 6! Sometimes kids see this and their brains tell them to think about 9 – 6 and they put 3 in the 10’s place! But we know, you have to “borrow” from the 100’s place and actually subtract 16 – 9 = 7 (note…I am ignoring place value here since that is the traditional thing to do).

Finally, move to the 100’s place. Remember we borrowed 1 (ignoring place value and meaning) from the 5 to make it 4. So, 4 – 2 = 2 so put a 2 in the 100’s place.

There is so much going on here that a 3rd grader has to figure out. The creator of this image chooses to omit it in order to present a stark contrast from “the old way” to the “common core way.”

Making sense of mathematics (in this case 3rd grade subtraction) as I have tried to do in this blog post is not crazy…it is not new….it is just MATH!*


*Credit to Dr. Ted Coe!


Quote  —  Posted: September 18, 2015 in Teaching and Learning Philosophy
Tags: , ,

I am one of the most conservative political persons you can imagine and as such I have been quite frustrated with those that are aligned with me politically and the closed-minded stance that they have taken to the Common Core standards. From Conservative political candidates for president to politically active Conservative individuals, many have exhibited their ignorance (defined as: one with a lack of knowledge or information) in many instances. Therefore, it was refreshing to learn that the Lutheran Church Missouri Synod, of which I am an active member, formally published a document recently that demonstrated a positive and accurate reaction to the CCSS from a Conservative Christian perspective. Here are some of the important points made in “Should Lutheran Schools Consider Adopting the Common Core State Standards?”

  1. Lutheran schools have a rich heritage and long standing commitment to academic excellence that is rooted in the Christ-centered mission that flows from the Lutheran Confessions. The Common Core State Standards may serve as a tool that enhances curriculum development. They could provide additional guidelines upon which the rigorous programs of study for our students could be designed. The rigor is not the product of the CCSS standards alone; rather, is connected with the instructional process provided by Lutheran educators.
  2. The Common Core State Standards suggest a set of high-quality academic expectations that all students should master by the end of each grade level. They propose consistent grade-level learning goals for all students and inform parents about learning outcomes, thereby making it easier for parents to collaborate with teachers in helping their children achieve success.
  3. The Common Core State Standards are not a curriculum. (emphasis added) A curriculum includes what, when and how subjects are taught and what materials to use. These matters are not dictated by the Common Core State Standards. For Lutheran schools, these elements will continue to be determined by individual schools, working to meet the needs of their students.
  4. The Common Core State Standards represent a fundamental shift in the teaching and learning process. They establish clear, measurable goals for students that assist teachers in making instructional decisions. They place emphasis on creativity, critical and analytical thinking and application to curriculum content. They may serve to assist our schools in guiding the way that instruction takes place in each classroom while allowing the school to develop its own unique curriculum content.
  5. The Association of Christian Schools International (ASCI), Christian Schools International (CSI) and The National Catholic Educational Association (NCEA) support the move toward the Common Core State Standards. The reason? – Its focus on rigor, relevance, best practices, and college and career readiness.
  6. Ultimately, Lutheran schools will determine independently which standards to follow. The process of that discovery must remain true to The Lutheran Church—Missouri Synod’s (LCMS) Christ-centered mission: to provide a solid, Christian education developed with standards that drive instruction so that every child can be reached with an effective education – one that centers on the LCMS faith. The Common Core State Standards may be considered a tool that would allow LCMS schools to more fully prepare its students for service and witness to Christ and the world.

What I find the most reassuring about this document is that if one will take an honest look at the standards themselves with an open mind to assessing their quality removed from the political process and scheming that many see how powerful and helpful they are!

Trey Cox, Ph.D.

The following article was written by Dr. Jo Boaler:

Jo Boaler is a professor of mathematics education at Stanford University, co-founder of http://www.youcubed.org, and author of What’s Math Got To Do With It: How Teachers and Parents can Transform Mathematics Learning and Inspire Success. (Penguin, 2015)

Memorizers are the lowest achievers and other Common Core math surprises

Opinion

Memorizers are the lowest achievers and other Common Core math surprises

In this Feb. 12, 2015 photo, Yamarko Brown, age 12, works on math problems as part of a trial run of a new state assessment test at Annapolis Middle School in Annapolis, Md. The new test, which is scheduled to go into use March 2, 2015, is linked to the Common Core standards, which Maryland adopted in 2010 under the federal No Child Left Behind law, and serves as criteria for students in math and reading.

In this Feb. 12, 2015 photo, Yamarko Brown, age 12, works on math problems as part of a trial run of a new state assessment test at Annapolis Middle School in Annapolis, Md. The new test, which is scheduled to go into use March 2, 2015, is linked to the Common Core standards, which Maryland adopted in 2010 under the federal No Child Left Behind law, and serves as criteria for students in math and reading. 

It’s time to debunk the myths about who is good in math, and Common Core state standards move us toward this worthy goal. Mathematics and technology leaders support the standards because they are rooted in the new brain and learning sciences.

All children are different in their thinking, strength and interests. Mathematics classes of the past decade have valued one type of math learner, one who can memorize well and calculate fast.

Yet data from the 13 million students who took PISA tests showed that the lowest achieving students worldwide were those who used a memorization strategy – those who thought of math as a set of methods to remember and who approached math by trying to memorize steps. The highest achieving students were those who thought of math as a set of connected, big ideas.

The U.S. has more memorizers than most other countries in the world. Perhaps not surprisingly as math teachers, driven by narrow state standards and tests, have valued those students over all others, communicating to many other students along the way – often girls – that they do not belong in math class.

The fact that we have valued one type of learner and given others the idea they cannot do math is part of the reason for the widespread math failure and dislike in the U.S.

Brain science tells us that the students who are better memorizers do not have more math “ability” or potential but we continue to value the faster memorizers over those who think slowly, deeply and creatively – the students we need for our scientific and technological future. The past decade has produced a generation of students who are procedurally competent but cannot think their way out of a box. This is a problem.

Mathematics is a broad and multidimensional subject. Real mathematics is about inquiry, communication, connections, and visual ideas. We don’t need students to calculate quickly in math. We need students who can ask good questions, map out pathways, reason about complex solutions, set up models and communicate in different forms. All of these ways of working are encouraged by the Common Core.

Technology leaders are publically arguing that calculation is not math, and that math is a much broader subject. Conrad Wolfram, one of the leaders of one of the world’s most important mathematics companies, Wolfram-Alpha, urges schools to stop emphasizing calculating and focus instead on problem solving, modeling, thinking, and reasoning as these are the mathematical abilities that students need in the workplace and their high tech lives. This broad, multidimensional mathematics is the math that engages many more learners and puts them on a pathway to life long success.

Part of the problem in the U.S. is the desperation of many parents to advance their children in math, pushing them to higher levels of math faster and sooner, somehow believing that a resume packed with advanced math courses will guarantee their future. Bill Jacob, a mathematics professor at the University of California, Santa Barbara, speaks openly about the dangers of students being pushed to higher levels of mathematics too soon. “I know it is hard to persuade parents that their students shouldn’t race to get calculus, but I really wish they wouldn’t. Too much content and depth is left out when they do.” said Jacob, who is not alone in saying that he would rather have students in his university mathematics courses that have breadth in their mathematical experiences than any additional Advanced Placement courses. Experts in England are giving the same advice to parents of high achieving students. Geoff Smith, chairman of the British and International Math Olympiads warns that accelerating children through the system is a “disaster” and a “mistake”. He, like me, recommends that high achieving students explore the mathematics they are learning in depth, instead of rushing forward.

Mathematics is not a subject that requires fast thinking. Award winning mathematicians talk about their slow, deep thinking in math. Fields Medal winning mathematician Laurent Schwartz wrote in his autobiography that he felt stupid in school because he was one of the slowest thinkers in math. Eventually he realized that speed was not important – “What is important is to deeply understand things and their relations to each other.  This is where intelligence lies. The fact of being quick or slow isn’t really relevant.”

Some school districts, such as San Francisco Unified, are trying to slow down the math experience, requiring that advanced students go deeper rather than faster. Students still reach calculus but the pathway to calculus consists of deep understanding rather than procedures and memorization. This is an important move. There is no harm in students being introduced to higher-level mathematics earlier, as long as the mathematics is enjoyable and ideas can be explored deeply. Third graders can be fascinated by the notion of infinity, or the fourth dimension, but they do not need a race through procedural presentations of mathematics.

New brain science tells us that no one is born with a math gift or a math brain and that all students can achieve in math with the right teaching and messages. The classrooms that produce high achieving students are those in which students work on deep, rich mathematics through tasks that they can take to any level they want. No one is told what level they can reach and no one is held back by narrow questions that limit students’ mathematical development and creativity.

Many people across the U.S. have gross misconceptions about mathematics learning, thinking that mathematics is a narrow subject of memorization and speed and that people who do not calculate fast or memorize well are not ‘math people’. We need to change the conversations about mathematics, communicating to all children that they can learn. We also need to change the way math is taught, valuing the different ways of thinking that are so important to the subject. Mathematics, itself, needs this and although change is hard, it should be embraced.

We need to broaden mathematics and open the doors of mathematics to all students. When we do this we will see many more creative, energized young people equipped to think quantitatively about our ever-changing world. We all need this.

Jo Boaler is a professor of mathematics education at Stanford University, co-founder of www.youcubed.org, and author of What’s Math Got To Do With It: How Teachers and Parents can Transform Mathematics Learning and Inspire Success. (Penguin, 2015)

This story was produced by The Hechinger Report, a nonprofit, independent news organization focused on inequality and innovation in education. Read more about Common Core.

“Five percent of the people think;
ten percent of the people think they think;
and the other eighty-five percent would rather die than think.”

-Thomas Edison

I don’t know exactly what Edison meant by this or how he determined the percentages, but the message, to me, is this: thinking is not what people do well!

On a recent Sunday news show, Texas governor Greg Abbott claims that the Common Core State Standards are bad because “it takes a teacher more than a minute to teach a student how to learn that 9+6=15”. He is referencing this video. Check it out.

Let’s think about this. How is this an argument against Common Core?

Is teaching a student how to think about 9+6 = 15 a bad thing? There is a difference between just doing 9+6 and thinking about 9+6. The Common Core Standards clearly have an emphasis on procedural fluency. Students should be able to determine that 9+6=15 quickly. But, how will such fluency happen? It will happen when students have a way of thinking about 9+6. Because it takes a minute to explain this thinking does not mean that it will take a student a minute to compute! Furthermore, the expectation is to push mental math…a good thing! For a student to flexibly be able to see 9+6 as equivalent to 10+5 is very good!

Governor Abbott does not have the opportunity to explain how he believes students should be taught that 9+6=15, but I will make a conjecture that he will argue that students should just memorize it. And in saying this, what would he mean by “just memorize it”? Perhaps something like this (and I embellish):

Teacher: “OK Johnny, this shape right here (9) is called the number 9 and this shape right here (6) which kind of looks like an upside-down 9 is called the number 6. And when you put this symbol in between this (9) and this (6) the answer is two shapes…a 1 which sits right next to a 5. So 9 + 6 = 15”
Johnny: “But why?”
Teacher: “Don’t ask why…just memorize it. Let me get the flashcards.”

We might as well do something like this:

Teacher: “OK Johnny, let me tell you something that I want you to memorize. If you take purple and add dog the answer is banana.
Johnny: “But why?”
Teacher: “Don’t ask why…just memorize it. Let me get the flashcards.”

The teacher in the video is just unpacking the mathematical thinking necessary for a student to make sense of what 9+6=15 means and how this fact might be memorized in a meaningful way. Certainly, we expect students to be able to respond to 9+6 in just a few seconds. This memorized fact will be retained when the mathematical reasoning and thinking, done by the student, allows the student to make meaning and make sense of the computation.

And by the way…this kind of thinking, to allow students to memorize basic math facts, has been around long before the Common Core Standards! This is not a Common Core thing…this is just good teaching.

Diane Briars, president of the National Council of Teachers of Mathematics, says this about the issue: “Teachers have used techniques like splitting a number into parts of 10 for addition–rather than straight memorization–since the 1950s at least, and the research showing its benefits goes back to the 1920s. It has long been best practice for early childhood math.”

I encourage everyone…please read the Common Core Standards and understand their purpose. Then, if you want to debate the issue of the federal government offering federal money tied to the implementation of these standards, great! If you want to debate standardized testing, its cost, its taking instructional time, its impact on the mental health of students, teachers, and parents, great! But please…do not conflate these issues. Standards are standards…teaching is teaching…curriculum is curriculum…testing is testing. My experience is, when people actually consider the Standards, the issue is not the Standards! When they see that students are expected to become effective problem solvers, mathematical thinkers, and fluent in computations, most agree that the Standards are not a problem.

When people try to show that the Standards (not the role of the feds, not standardized testing, etc.) are bad, it is clear that they are not really thinking…


There seems to be a common theme among the complaints about the Common Core Standards. Parents say, “that’s not the way I learned it…why not just do it the “old fashioned” way?”

Part of the reason is this: Because we are trying to prepare students for a new, modern world! Years ago, it was very important for people to become very accurate with paper and pencil computations. That’s just not the case anymore. Now, it is important that we take a balanced approach…a balance between computational fluency AND conceptual understanding AND the ability to apply mathematical ideas to solve real-world problems. This is exactly what the common core standards have as a major focus…a balanced approach!

Here is a question that we all should think about…how does a young learner develop computational fluency? Does it just happen magically? The following videos seek to answer the question in the context of addition algorithms, subtraction algorithms (videos made by Dr. Scott Adamson) and multiplication (video by Dr. Raj Shah).

ADDITION ALGORITHM

http://www.screenchomp.com/t/1CXpvMoLDq

SUBTRACTION ALGORITHM

http://www.screencast.com/t/NULauMxJ6

MULTIPLICATION ALGORITHM

http://vimeo.com/110807219

Scott

Here is the latest (for me) bashing of the common core standards:

http://toprightnews.com/?p=6326

Again, the subject of the bashing is subtraction…I find it interesting that subtraction seems to be taking the biggest hit when it comes to common core bashing!

common-core-math

The blogger says, “Here is the insane method” they came up with to utterly confuse 4th graders about subtraction:”

Insane? Utterly confuse? I think not!

Consider this: Albert Einstein was born in 1879 and died in 1955. How old was he when he died? Think about it…then pay attention to how you thought about it…

AE

Many adults think about this situation like this:

  • Starting with 1879, it takes 21 years to get to 1900.
  • Then, another 55 years takes us to 1955.
  • So, Einstein was 21 + 55 = 76 years old (or would have turned 76) in 1955.

This is the “counting up method” described in the textbook! This method seems SANE and UTTERLY sensible to me!

As I have explained in other posts (Part I, Part II, Part III, Part IV, Part V, Part VI), the main issue is how one thinks about subtraction. If one only thinks about subtraction as “take away” then their understanding is incomplete. We can also think about subtraction as a comparison…which is really what is happening here. We are comparing 1955 to 1879 to see how many years have elapsed. Furthermore, think about the method (yes, it is a method!) described early…first add 21 years…then add 55 years…and compare that method to the standard subtraction algorithm from a “take away” perspective.

Capture
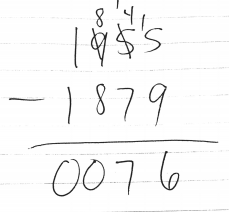
With the double borrowing, mistakes can be made. In addition, I am a fan of mental math…it can absolutely be a helpful and healthy thing to keep track of quantities mentally!

The goal…and who can really argue this…is for students to become fluent, flexible, and efficient with computations.

  • Fluent in a way similar to becoming fluent in a foreign language…comfort, ease, speed, and confidence are all hallmarks of fluency.
  • Flexible in the sense that a student will use an algorithm if necessary, use a counting up strategy if possible, or other strategies learned in school.
  • Efficient in the sense that a student will choose a strategy that is appropriate for the task at hand. For example, in the Einstein example, I argue that the counting up strategy is more efficient than the traditional algorithm…at least for those who have been trained to think that way!

Scott