The graphing calculator has changed how mathematics is taught and what mathematics is taught in school mathematics (Burrill, Allison, Breauz, Kastberg, Leatham, Sanchez, 2002). Students can experience mathematics in ways that were inaccessible prior to the introduction of the graphing calculator into mathematics education. With the availability of graphing technology as well as other technology, it is important for students to interpret the meaning of computational outputs provided by this technology. It is our contention that many students are not able to provide meaningful interpretations of the computational outputs provided by technology and feel they are engaged in a game of trivial pursuit – a mindless exercise of seeking facts and trivia. To illustrate my point, consider a situation when a student is asked to create a linear regression model and is asked to interpret the meaning of the coefficient of determination ( r^2 ). A typical response would be: “if the value of r^2 is close to 1 then that is “good” and if the value of r^2 is not close to 1 than that is “bad”. We suggest that this is evidence that the student is engaged in the pursuit of trivia and may respond with a true statement when asked, but, could not explain the meanings involved in the coefficient of determination. Furthermore, our experience tells us that students are often unable to give the details of how the coefficient of determination is computed and as a consequence cannot articulate what this particular statistic is measuring thereby rendering the whole exercise of determining the value pointless.
We believe that an overarching goal of mathematics education ought to be to engage students in the activity of sense making which can lead to a profound understanding of a particular mathematical idea (Ma, 1999). The National Council of Teachers of Mathematics claim that a “high school mathematics program based on reasoning and sense making will prepare students for citizenship, for the workplace, and for further study.” (NCTM, 2009). Furthermore, “a focus on sense making, when developed in the context of important content, will ensure that students can accurately carry out mathematical procedures, understand why those procedures work, and know how they might be used and their results interpreted.” (NCTM, 2009).
In this article, we specifically focus on making sense of the coefficient of determination and suggest that this be an important endeavor for students studying linear functions in an algebra course and not just for students taking statistics. With the wide spread use of the graphing calculator in the algebra classroom, we believe that teachers should be encouraged to help students make sense of all numerical quantities that they are asked to calculate including the coefficient of determination. The importance of statistical literacy is highlighted in a recent article written by NCTM president J. Michael Shaughnessy who says, “statistical literacy has risen to the top of my advocacy list, right alongside numeracy, and perhaps even ahead of “algebra for all”” (Shaughnessy, 2010).
The goal of this article is to present a way that students can be encouraged to make sense of the coefficient of determination while studying linear function models (linear regression models) in an algebra course. We hope that readers might consider the approach taken here and adapt it for students so that they are afforded the opportunity to make sense, and ultimately demonstrate a profound understanding of the coefficient of determination.\
Why Is It Called Regression?
Why is the process of generating a linear function model for a given data set called “linear regression?” During the 1870‟s, Sir Francis Galton studied the heights (he called it stature) of parents and their offspring. He investigated the relationship between the average height of parents that the height of their offspring. What Galton observed and recorded was that the offspring of particularly tall parents were also tall – but not as tall as their parents. The offspring of particularly short parents were also short – but not as short as their parents. That is, the offspring of these parents tended to be less tall or less short – they regressed toward the mean height of the population.
We see this “regression toward the mean” in many real-life situations. If a basketball player scores an extraordinarily high number of points in one game, he most likely will not score as many points in the next game. The number of points will “regress toward the mean” or be closer to the player‟s average number of points per game. The coefficient of determination is computed, and ultimately understood, as we compare data values to the mean (average) of the values in the data set.
Coefficient of Determination
Graphing calculators can be set to output the coefficient of determination, r^2, when computing a linear regression model.
The coefficient of determination is a value that describes the strength of the fit of a linear regression model to a set of data. The stronger the fit, the closer this value, r^2, is to 1. However similar claims can be determined by interpreting the correlation coefficient, r , so being able to understand the coefficient of determination can help one distinguish between these two values. This leads us to ask, how is r^2 computed and what does it mean? We explore a contextual situation in answering these questions.
According to a U.S. Internal Revenue Service review of tax returns and a survey conducted by Indiana University, the total amount of private philanthropy funds increased during the 21st century (Source: Statistical Abstract of the United States, 2006; Table 570). Private philanthropy is the act of donating money, by individuals, corporations, or foundations, to support a charitable cause. For example, many colleges and universities accept private philanthropy to fund scholarships for financially needy students. Another example is the George Carver Academy in San Antonio, Texas that is funded by the private David Robinson foundation. We will compute a linear regression model for private philanthropy data then we explore the computation of the coefficient of determination and discuss its meaning.
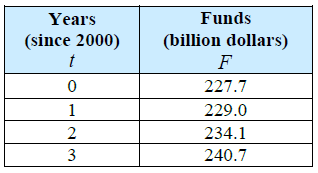
The table shows the amount of money donated by U.S. residents, corporations and foundations for philanthropic purposes from 2000 to 2003 (Source: Statistical Abstract of the United States, 2006; Table 570). Algebra teachers often ask students to generate a linear regression model for the data, to interpret the parameters of this model (the vertical intercept and the constant rate of change) in the context of the situation, and to use the model to make a prediction (extrapolate or interpolate).
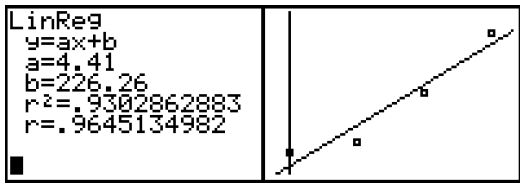
We use a graphing calculator to compute the linear regression model.
We write this linear regression model F(t) = 4.41t + 226.26 . The model suggests that in 2000 ( t = 0 ), $226.26 billion in private philanthropy funds was given and the amount increases each year at a constant rate of $4.41 billion per year. We can use this model to predict the amount of private philanthropy funds that will be given in 2010. Since 2010 is ten years after 2000, we substitute into this regression model.
F(t) = 4.41t + 226.26
F(10) = 4.41(10) + 226.26 = 270.36
Using the regression model, we predict that $270.36billion in private philanthropy funds will be given. Furthermore, we can see that the coefficient of determination is approximately 0.93. But how is the coefficient of determination value computed and what does it represent? The coefficient of determination is computed by determining the percentage of “error” that is explained by the linear regression model. In this context, error does not mean mistake. Rather, error is a vertical measurement on the graph of the scatterplot with the regression model. More specifically, there are three types of error – explained error, unexplained error, and total error. These error measurements involve the arithmetic mean (average) and are computed by finding the difference between this mean and the actual data values or the values predicted by the linear model. It is important to recognize that the difference between a data value and the mean of the data values may be a positive or negative number. The absolute value of this number
represents the vertical distance (either above or below) between the data value and the mean of the data values. An alternative way to make negative differences into positive values is to square each difference. This is the approach used in calculating the total error. The total error is the sum of the squares of the differences between the actual data value and the mean of the data values.
To visualize the total error, we compute the arithmetic mean and place it on the scatter plot of the data (see the horizontal line below at 232.875).

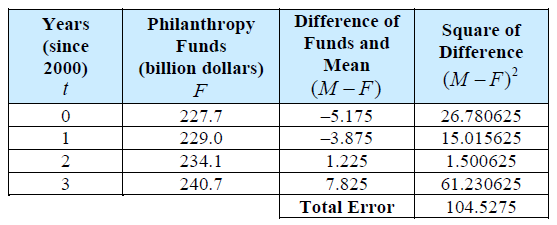
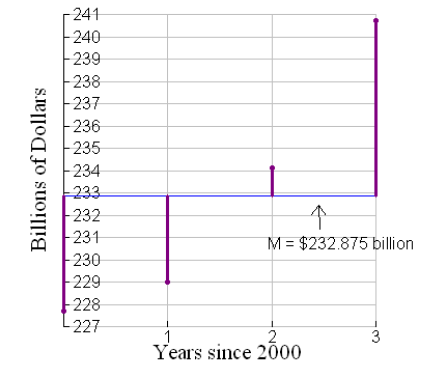 To compute the total error, we find the difference between mean and the data point value, as shown in the graph, by subtracting the data value from the mean. We square this difference so that we do not have to consider whether the value is positive or negative. However, we will recognize that differences (prior to squaring) that are negative indicate data values that are below the mean and differences that are positive indicate data values that are above the mean. The total of the squares of these differences is known as the total error.
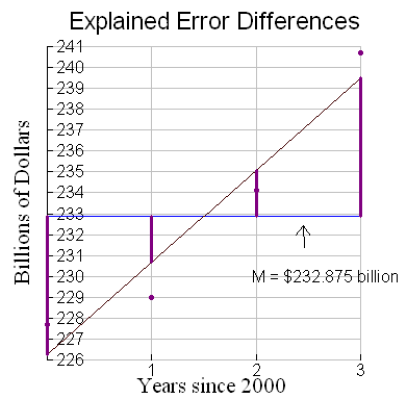
 This total error can be split into two pieces – the explained error and the unexplained error. The explained error is the sum of the squares of the differences between the regression model output values and the mean.
 The sum of the squares of the differences between the actual data values and the regression line output values is known as unexplained error. This is the rest of the total error that is not taken up by, or explained by the model.
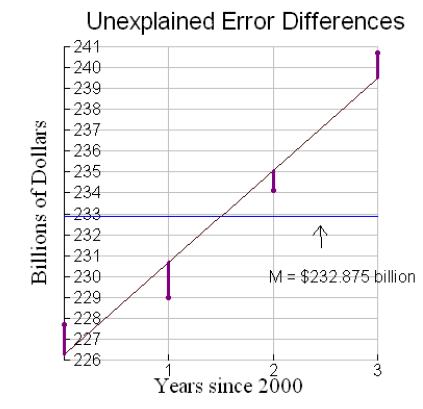 As we examine these graphs, we see that the explained error (total sum of the squares of the differences between the regression line and the mean) seems to be greater than the unexplained error (total sum of the squares of the differences between data values and the regression line). The coefficient of determination is a computation showing the percent of the total error that is explained or “taken up by” the regression line. Recall that the total error is 104.5275. What percentage of this total error is explained? What percentage is unexplained?
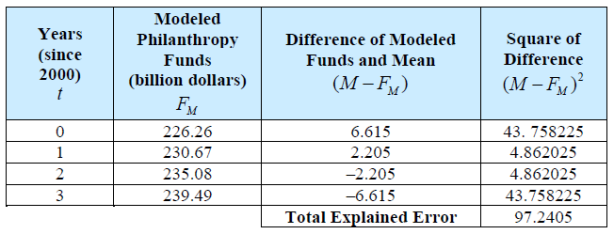
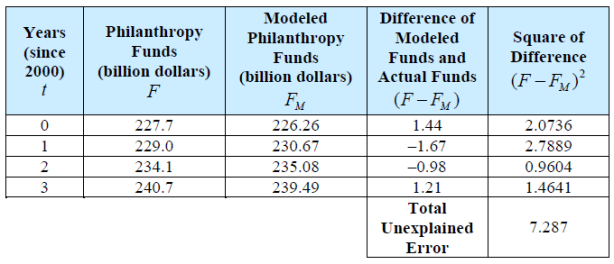 The total error is 104.5275. Of this, 97.2405 is explained and 7.287 is unexplained. As a percentage we find that 93.03% of the error is explained. This value is known as the coefficient of determination. This computation confirms the calculator output for r^2.

Making Sense of the Coefficient of Determination
We can go beyond just computing the coefficient of determination to see if it matches with the value that the calculator gives. By examining the computation process, we can see that this value provides useful information about the strength of fit of the regression model to the data set and helps one to further differentiate between r and r^2. We look at two extreme hypothetical situations to make sense of this value. Consider the following hypothetical situation of a perfectly linear data set.
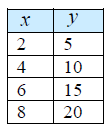 The mean of the y values of the data set is 12.5.
 We see, by looking at a scatter plot of the data, that these data are perfectly linear. Since each data point lies on the regression line, we see that the total error differences (difference between the data value and the mean) and the explained error differences (difference between the regression line and the mean) are the same.
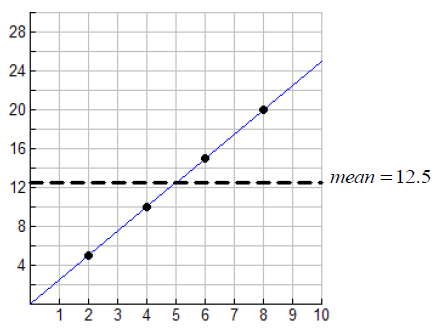 Since the total error differences (difference between the data point and the mean) and the explained error differences (difference between the regression line and the mean) are the same, the ratio of explained error to total error is 1.
 Also, the unexplained error differences (difference between data point and regression line) total 0. That is, all of the total error is taken up by or explained by regression model. We now consider a situation where two quantities have very little or no relationship.
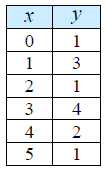
The mean of the y values of the data set is 2.
 In this special situation, the regression model is y = 2; the same as the mean.
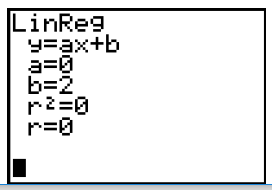 The total error (differences between the actual data value and the mean) is a relatively large value, as seen in the graph.
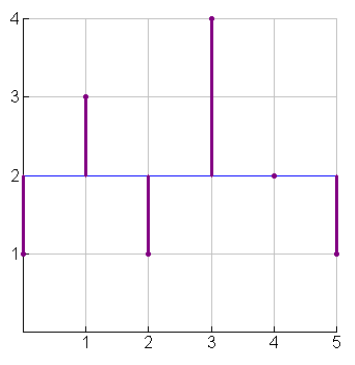 However, the total explained error (difference between the linear regression model and the mean) will be 0 since these two lines coincide.
 By examining these distances, we can estimate the value of r^2 , the coefficient of determination, and do not need to rely solely on the calculator to output the number. Remember, the coefficient of determination measures the strength of fit of the linear regression model to the actual data. The stronger the fit, the closer r^2 will be to 1.
Estimating the Coefficient of Determination
The data in the graph show the number of registered vehicles in the United States for selected years after 1980 (Statistical Abstract of the United States, 2006; Table 1078). The horizontal line in the graph is the mean of the data set. We can estimate whether the coefficient of determination is closer to 0, closer to 0.5, or closer to 1 and explain how we know.
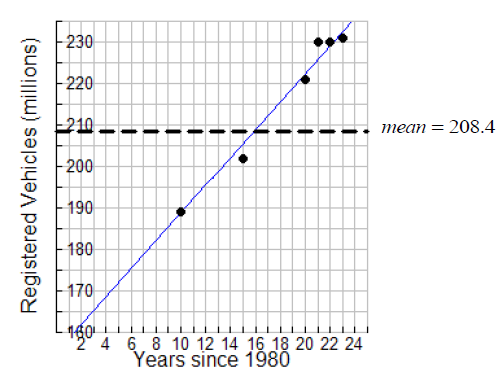 It appears as though the coefficient of determination would have a value that is close to 1. We see that the total error (difference between the actual data points and the mean) and the explained error (differences between the regression line and the mean) are very similar. The coefficient of determination value, r^2 , is the ratio
  This ratio is close to 1 since the values of the numerator and denominator are nearly equal.
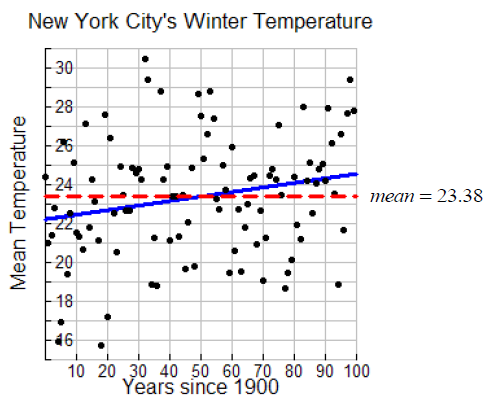
The data in the graph show the average winter temperature in New York City for years after 1900 (www.ncdc.noaa.gov). The horizontal line in the graph is the mean of the data set. We can estimate whether the coefficient of determination is closer to 0, closer to 0.5, or closer to 1 and explain how we know.
It appears as though the coefficient of determination would have a value that is close to 0. We see that the total error (differences between the actual data points and the mean) will be relatively large due to the fact that the data are so spread out around the mean of 23.38o. However, the explained error (differences between the regression line and the mean) is relatively small. The coefficient of determination value, r^2 , is the ratio  This ratio is close to 0 since the numerator is relatively small and denominator is relatively large.
Summary
This article raises several issues. One issue is related to the role that learning about the coefficient of determination ought to play in the algebra classroom. We support the notion that the coefficient of determination ought to be explored fully while students are studying linear function models developed from real-world data. With the widespread use of graphing calculators, this statistic is available to students and therefore should be investigated in terms of its method of computation which should then lead to its interpretation. A second issue is related to the notion that students should be afforded many opportunities to make sense of the mathematics they study. That is, students ought to learn that mathematics is something to be made sense of rather than a litany of trivia that is to be memorized. Students can learn to make sense of mathematical ideas only if they are given many opportunities to practice the mental exercise of doing so. The process of making sense leads to understanding of foundational mathematical ideas. It is our belief that students who strive to understand mathematics will be more successful and progress further in studying mathematics. Hiebert, et al. claim that “understanding breeds confidence and engagement; not understanding leads to disillusionment and disengagement (1999).” We have found that Algebra students will work to make sense of the coefficient of determination in the context of a linear function modeling situation and can demonstrate their understanding of the this statistic by estimating the value of the coefficient of determination given the opportunity and a supporting educational environment and curriculum.
References
Burrill, G., Allison, J., Breauz,G., Kastberg, S., Leatham, K., Sanchez, W. (2002). Handheld graphing technology in secondary mathematics: Research findings and implications for classroom practice. Texas Instruments
Hiebert, J., Carpenter, T., Fennema, E., Fuson, K., Wearne, D., Murray, H., et al. (1997). Making sense: Teaching and learning mathematics with understanding. Portsmouth, NH: Heinemann
Ma, L. (1999). Knowing and teaching elementary mathematics: Teachers’ understanding of fundamental mathematics in China and the United States. Hillsdale, NJ: Lawrence Erlbaum Associates, Inc.
National Council of Teachers of Mathematics (2009). Focus in high school mathematics: Reasoning and sense making. Reston, VA: NCTM
Shaughnessy, J.M. (2010). Statistics for all—The flip side of quantitative reasoning. NCTM Summing Up August 2010 Message from the President. Retrieved August 2, 2010 from http://www.nctm.org/abou /content.aspx?id=26327
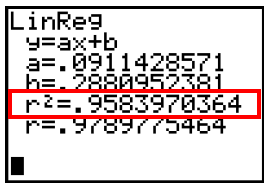
In your first example using philanthropy, the step-by-step calculations do not match the calculator output in any way that I can understand.
Thanks for reading and noticing this! The correct calculator image is now shown in that section!
Scott
I learned the process behind regression in my Numerical Methods class this semester. Luckily not too many hand calculations of the entire process but we did have to write the code for it in MATLAB. It was interesting to find out how “simple” the process behind linear regression is. For me seeing the backend of the whole process is what helped me understand why my teacher’s have said over the years to not blindly trust the rsquared! I think students learning minimizing/maximizing in differential calculus would benefit from a lesson in this. Most students by that time would have used regression many times. This is just what I was thinking about after reading this post!